
| Year | Att/Game | Total Att |
|---|---|---|
| 2016 | 29,987 | 37,633,356 |
| 2017 | 29,886 | 37,507,102 |
Overall attendance is down 0.3%, the same spot it was in at the beginning of June. With the All-Star Game coming next week, I wanted to see how the leagues stack up against each other. Five of the bottom six teams in attendance are in the AL, so I wasn't surprised at the results.
- National League: 31,653/game
- American League: 28,209/game
Biggest Increases
| Team | 2016 | 2017 | Difference |
|---|---|---|---|
| Braves | 23,123 | 30,415 | 32% |
| Indians | 17,964 | 22,889 | 27% |
| Rockies | 32,011 | 37,232 | 16% |
| Astros | 28,067 | 30,659 | 9% |
| Phillies | 24,428 | 26,548 | 9% |
Biggest Decreases
| Team | 2016 | 2017 | Difference |
|---|---|---|---|
| Royals | 32,921 | 27,311 | -17% |
| Pirates | 27,037 | 23,831 | -12% |
| Mets | 35,099 | 31,368 | -11% |
| Mariners | 27,807 | 25,284 | -9% |
| Tigers | 30,996 | 28,578 | -8% |
Featured




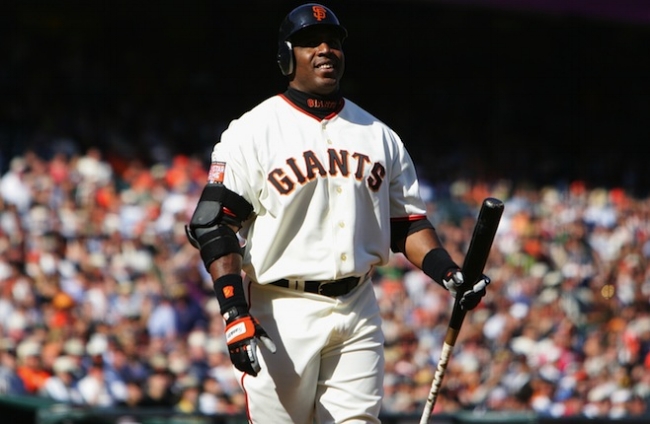


Baseball is here! And more importantly, that means the over/under game is back. It seems as though everyone is an expert this time of year. Somehow we convince ourselves that we are better at predicting baseball outcomes than everyone else. Well, AFITB is putting that to the test for the third year in a row. Think you know more about baseball than us? You probably do. But go ahead and prove it anyway.